Seeing what your SOC sees: the new SIEM section in Pulse
Managed security has a quiet flaw: when it works, there is nothing to look at. The latest release of Pulse, our client portal, changes that. You can now watch the activity our Security Operations Centre records across your estate as it happens, see every monitored machine, and open the same page for each one that our analysts use. Here is what has changed, why we built it this way, and how to get the most from it.
There is an awkward truth about buying security monitoring from someone else, and it is worth saying plainly before describing what we have just released. When a managed Security Operations Centre is doing its job well, the client experiences almost nothing. The alerts are triaged before anyone outside the SOC hears of them, the noise is absorbed, the odd real incident is handled, and what arrives at the client's end is a monthly report and the occasional ticket. That is exactly what the service is for. It is also, from the client's chair, indistinguishable from a service that is doing very little, and the difference between the two only becomes visible on the day something goes wrong. We have never been comfortable asking clients to take the difference on trust, and the release of Pulse that went live on 11 October 2026 is the largest step we have taken towards removing the need to.
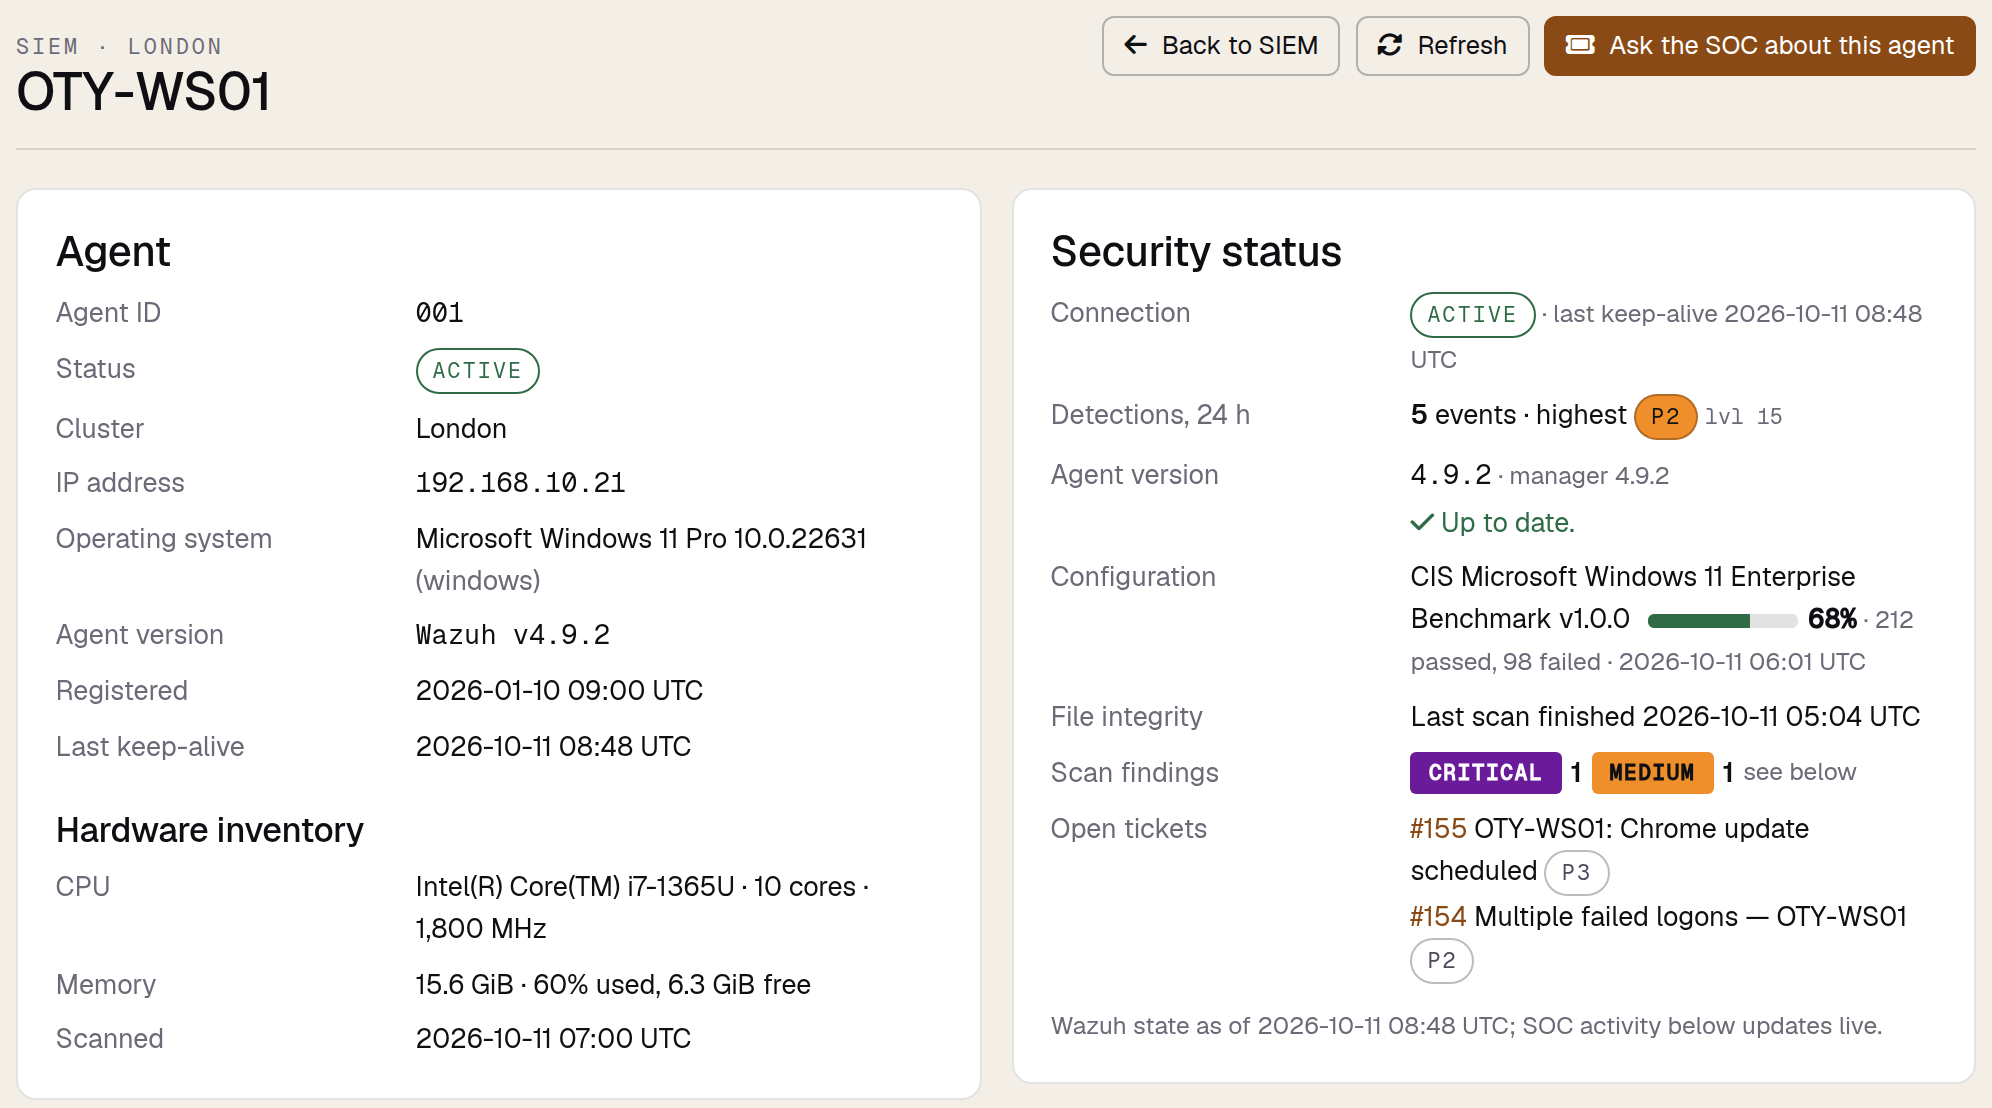
The short version is this. Pulse, our client portal at pulse.cyber-defence.io, now has a SIEM section. It shows you, live, the security events our SOC records across your estate. It lists every Wazuh agent enrolled for your organisation, searchable and sortable. And it gives every one of those machines its own page, bringing together its connection status, its detections over the last day, its score against its configuration benchmark, its file integrity status, the vulnerability scan findings that concern it, and the software installed on it. That page is not a simplified client version of something grander. It is the page our analysts work from, shown to you read-only and limited to your own machines. Nothing needs installing or changing on your side; if your organisation uses Pulse, the section is already there.
The rest of this article walks through what the section does and how to use it, and then sets out why we chose to build it the way we did, because the design decisions say something about how we think a SOC relationship ought to work.
Where it lives and what it replaces
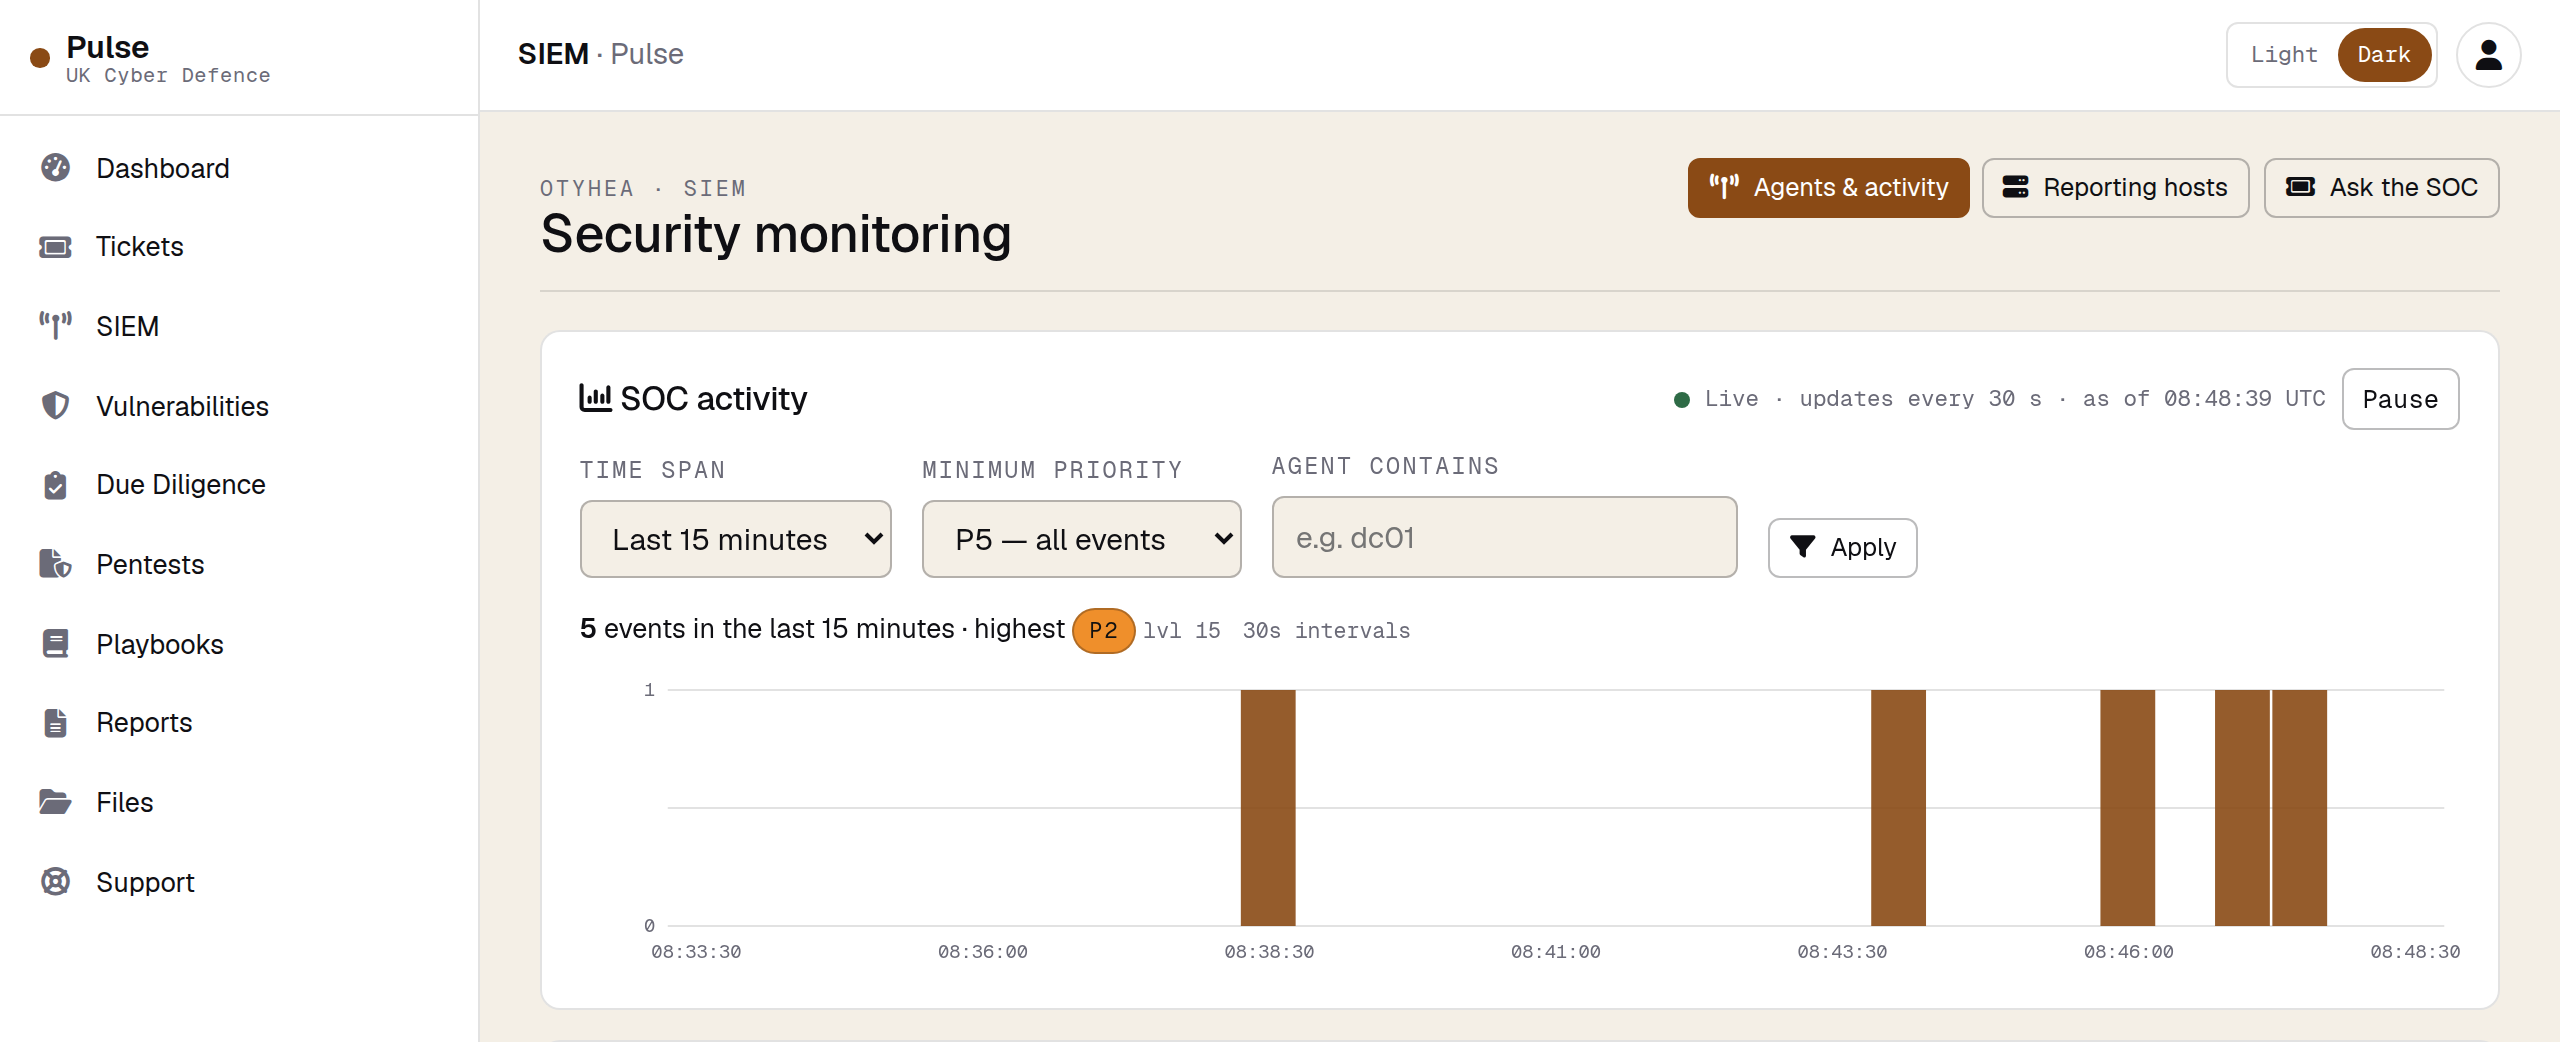
Sign in to Pulse as usual and the left-hand menu now carries a SIEM item, between Tickets and Vulnerabilities. Selecting it opens the Agents & activity page, which has two halves: live SOC activity at the top, opening on the last fifteen minutes, and beneath it the list of your agents. Two tabs at the top right of every SIEM page move you between Agents & activity and Reporting hosts, and an Ask the SOC button beside them opens a new ticket whenever you need one.
Two pages that longer-standing users will know, Connected agents and SOC activity, have moved inside the new section rather than disappearing. The first is now the Reporting hosts tab; the second is the activity view at the top of the main page. Links from your Dashboard and any bookmarks you have saved continue to work and carry you to the new location with the same time span and filters you had before. One small correction rode along with the move: the Dashboard's estate check-in figures for the last ten minutes and the last three hours now open exactly that window, where previously they opened the last twenty-four hours regardless of which figure you selected.
A note on the screenshots in this article: they are taken from our test environment and show a demonstration organisation, OTY Heavy Industries, and its machines. No client's data appears in them.
Watching the SOC work
The top of the page is the part most people will look at first, and it answers the question that sits behind the awkward truth above: what is the SOC actually seeing? The chart shows how many events arrived in each interval of the time span you have chosen, and the list beneath it shows the events themselves, newest first, with the time in UTC, the priority, the agent that reported the event and the detection rule that recognised it.
Three controls shape the view. Time span sets how far back to look, from the last five minutes to the last seven days. Minimum priority lets you concentrate on the more significant events: P1 is the most urgent and P5 includes everything, down to routine informational events, so choosing P3 and above hides the housekeeping and leaves the events most worth reading. Agent contains narrows the list to machines whose name includes the text you type, which is the quickest way to watch a single server or a group of similarly named hosts. Changes to time span and priority take effect at once; after typing a filter, select Apply.
The view keeps itself current, checking for new events every thirty seconds without reloading the page, and new arrivals are briefly highlighted. We spent a surprising amount of time on one detail here, which is that a live view that moves while you are reading it is worse than a static one. So the updates wait while you have an event open, while you are typing in a filter, or while you are looking at an older page of events, and resume as soon as you close the event or return to the newest page. Pause stops them altogether until you select Resume, and Older and Newer page through the list when there are more events than fit on one screen.
Select any event to open it. Every field the SOC holds for that event is listed, including the original log line where there is one, and the event's reference appears at the foot so that you and an analyst can be sure you are talking about the same thing. Two buttons sit above the fields: View agent opens the page of the machine that reported the event, and Ask the SOC about this event opens a ticket with the event already attached, which I will come back to.
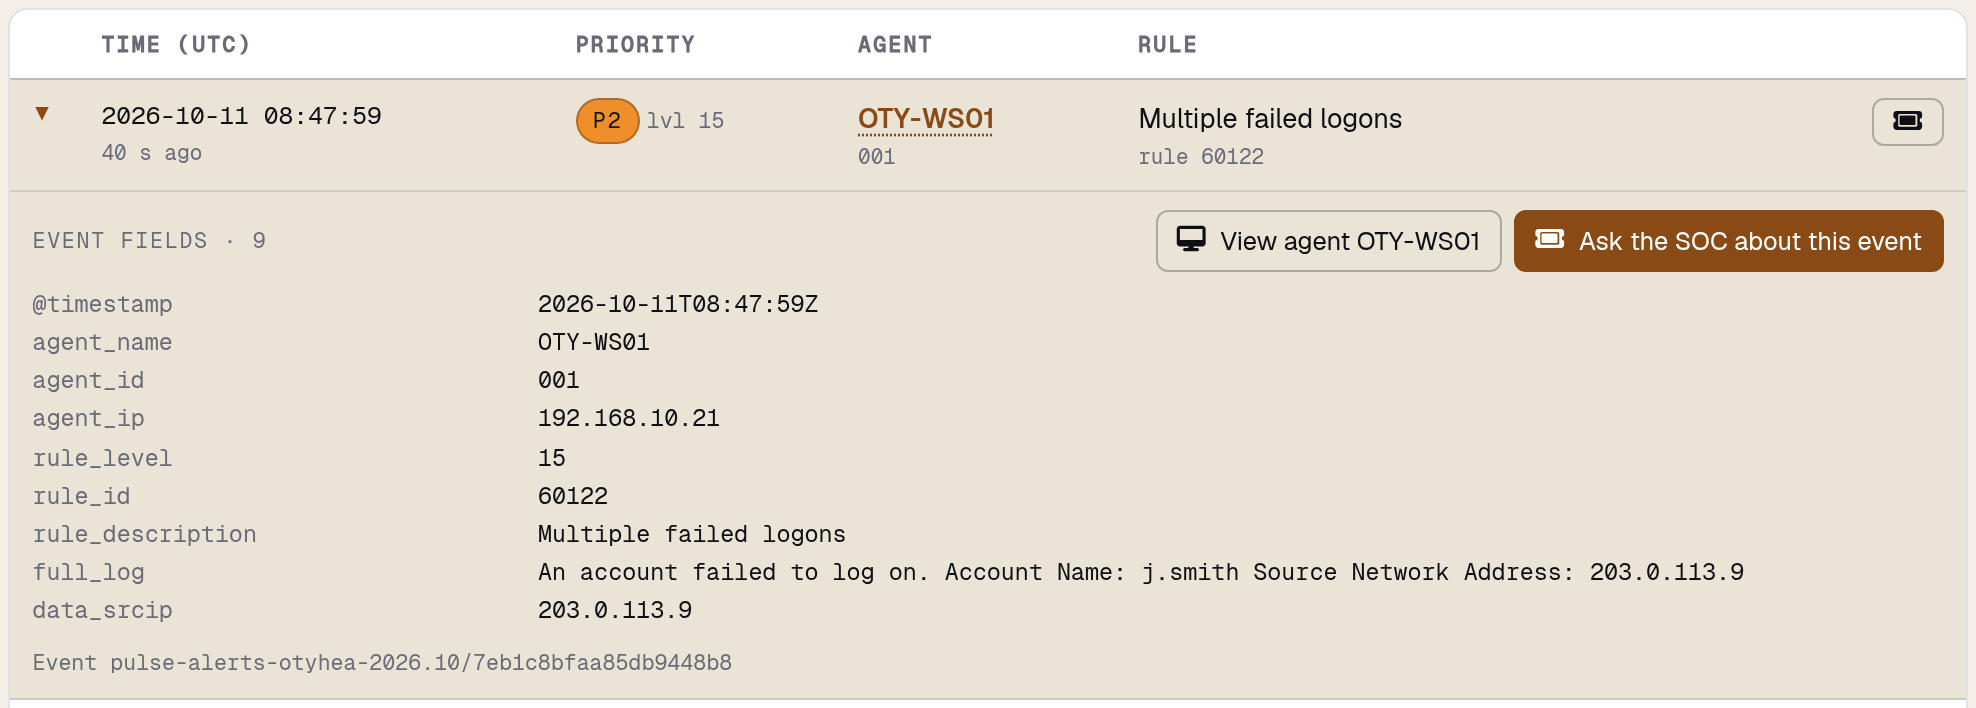
You can also jump to a machine directly from the list by selecting its name in the Agent column. Names appear as links whenever they belong to one of your enrolled agents. A device that sends its logs to us without a Wazuh agent, a firewall for instance, has no agent page and so is shown without a link; its events are still there, it simply has nothing further to open.
Your agents, all of them
Below the activity view is the list of every Wazuh agent enrolled for your organisation. The row of buttons at the top counts your agents by status and doubles as a quick filter. The list opens on Active agents and All shows every agent whatever its state. The statuses are worth a moment, because they are the first place to look when something seems to be missing.
| Status | Meaning |
|---|---|
| Active | The agent is connected to our SIEM and reporting normally. |
| Disconnected | The agent has reported before but is not in contact at present, for example because the machine is switched off, travelling without a connection, or has been retired. |
| Never connected | The agent has been registered but has not yet reported, usually because installation has not been completed on the machine. |
| Pending | The agent has registered and is completing its first connection. |
The Search box finds agents by name, IP address, agent ID or operating system. The Status filter does the same as the count buttons, and where your agents report to more than one of our SIEM clusters a Cluster filter appears as well. Every column heading sorts the list, and selecting it again reverses the order. Two sorts earn their keep immediately. Sorting by Version brings the oldest agent software to the top, so you can see at a glance which machines are due an upgrade. Sorting by Last seen puts the machines heard from most recently first, which means the ones that have gone quiet gather at the other end of the list, where they are easy to find. Your search and sort survive the activity view's live updates, and the activity view's time span survives your searching and sorting, so the page does not keep resetting itself underneath you.
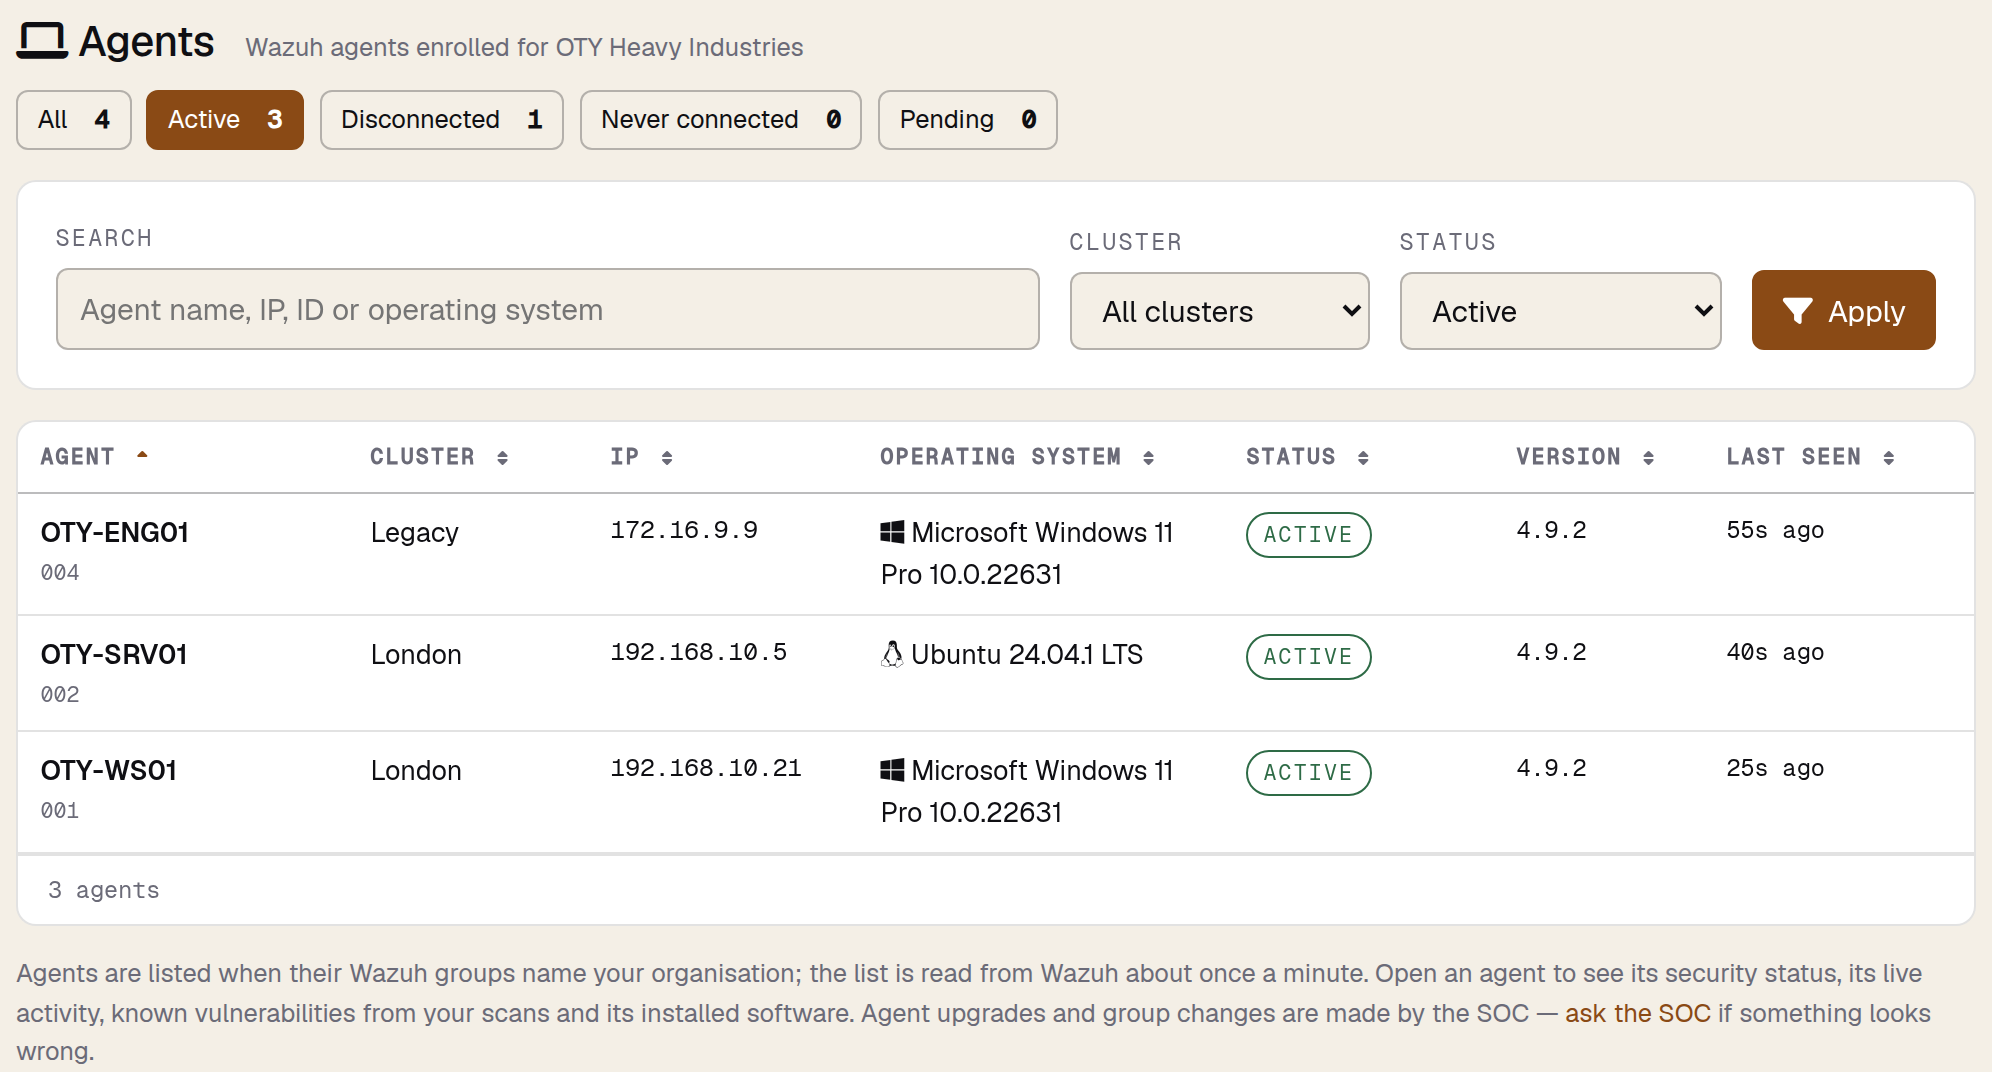
Select an agent's name to open its page, and Back to SIEM on that page returns you to the list exactly as you left it.
One page per machine
This is the heart of the release. Each agent now has a page that brings together everything the SOC knows about that machine, arranged so that the most important questions are answered at the top and the detail sits beneath. It is, as I said at the outset, the page our analysts use. We considered building a lighter version for clients and decided against it, for a reason I will expand on later: when you and an analyst are discussing a machine, the single most valuable thing is that you are both looking at the same picture.
The Agent card identifies the machine: its agent ID, status, the SIEM cluster it reports to, the IP address it connects to us from, its operating system, the version of the Wazuh agent it runs, when it was registered and when it last checked in. Beneath it, Hardware inventory shows the processor, the memory and how much of it is in use, and when the inventory was last taken.
The Security status card is the summary, and each of its lines answers a question a client has asked us at some point.
| Line | What it tells you |
|---|---|
| Connection | Whether the agent is connected, and when it last checked in with our SIEM. |
| Detections, 24 h | How many events the machine generated in the last 24 hours, and the highest priority among them. |
| Agent version | The version of the Wazuh agent on the machine against the version our SIEM runs. It reads Up to date when they match; when a newer version is available it says so, and the progress and result of an upgrade are shown here. |
| Configuration | The machine's score against its configuration benchmark, such as the CIS benchmark for its operating system, with the number of checks passed and failed and when the assessment last ran. |
| File integrity | When the last file integrity scan finished. File integrity monitoring watches important system files and settings for changes. |
| Scan findings | The open findings from your vulnerability scans that relate to this machine, counted by severity. |
| Open tickets | Up to three open tickets that mention the machine, each linked to its ticket page. |
The time at the foot of the card tells you when these details were last read from our SIEM, so there is never any doubt about how fresh the picture is.
Beneath the two cards is the machine's own SOC activity: a chart and the events from this machine alone, opening on the last five minutes and checking for new events every fifteen seconds, with the same Time span and Minimum priority controls, the same live behaviour and the same Ask the SOC about this event button as the main view. Then come three panels that between them turn the page from a status display into a working tool.
Known vulnerabilities
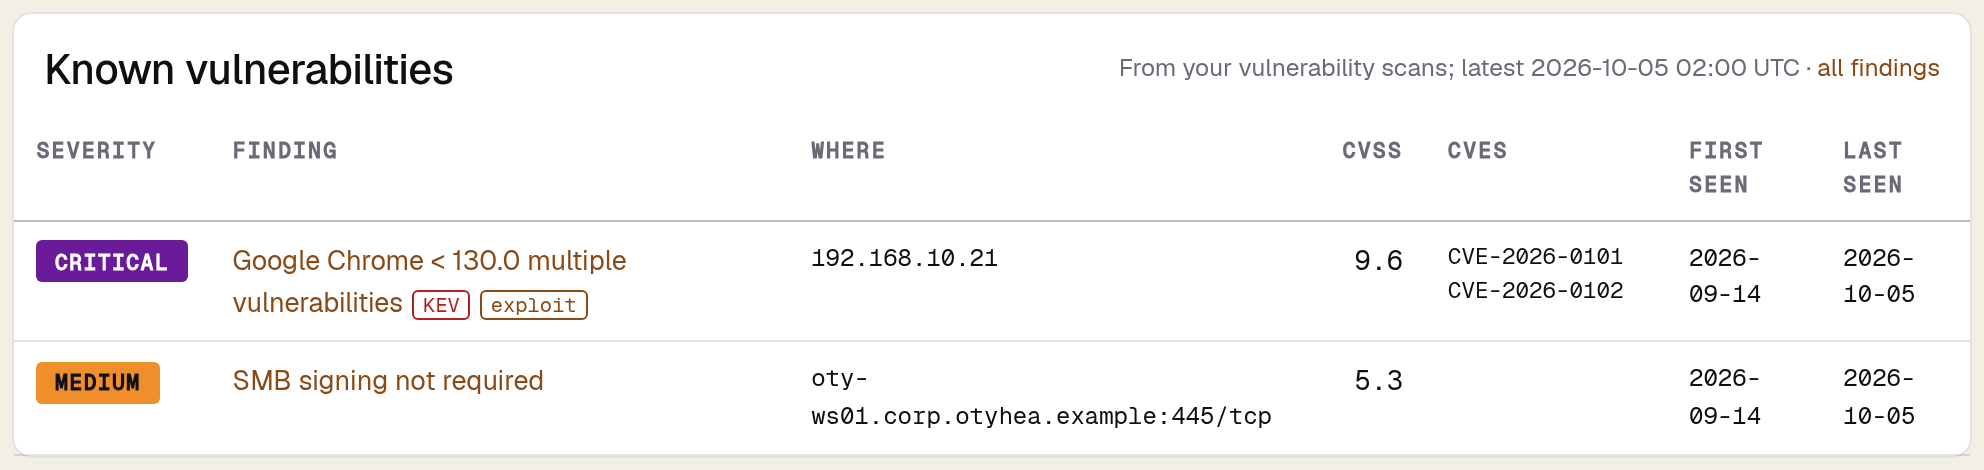
Known vulnerabilities lists the open findings from your vulnerability scans that relate to this machine. Scans and agents have historically lived in separate worlds, one keyed by hostname and IP address and the other by agent ID, and the two have been reconciled here: findings are matched on the machine's name, short or fully qualified, and on the network addresses the machine reports for its own interfaces. Each finding shows its severity, where it was seen as host, port and protocol, its CVSS score and CVE references, and when it was first and last seen.
Two tags deserve particular attention. A KEV tag marks a vulnerability that appears in the Known Exploited Vulnerabilities catalogue published by the US Cybersecurity and Infrastructure Security Agency, which is to say a flaw that is not merely theoretical but has been used in real attacks. An exploit tag marks one for which a public exploit is known. Both are a far better guide to what to fix first than a CVSS score alone, and seeing them beside the machine they affect, rather than in a separate scan report, is the point of putting them here. Select a finding to open its full page under Vulnerabilities, or all findings to see every finding across your estate. If you want to read further on any CVE you see, our CVE Explorer is free to use.
Installed software
Installed software lists the packages the agent has reported, with the version, vendor, architecture and installation date of each, and shows when the inventory was taken. The first five hundred packages appear in a scrolling panel in name order, and a search box finds a product by part of its name, vendor or version.
This panel answers what has become one of the most common questions of the last few years. A vulnerability in some widely used component makes the news, and within the hour someone asks whether we have it, where, and which version. Previously that was a question for the SOC, with a wait while someone ran a query. Now it is a search on each machine you care about, with the version and installation date shown against every match. For the estate as a whole the SOC can still answer faster than you can click through machines, and we will; but for the single server you are worried about at six in the evening, you no longer have to ask.

Keeping the picture current
The SOC activity on the page is live, and the connection status is never more than a minute or so old. The details that come from the agent itself, namely the hardware and software inventory, the configuration assessment and the file integrity status, are read from our SIEM at least every ten minutes, and Refresh at the top of the page reads them again at once. Bear in mind that the agent gathers its inventory and runs its assessments on its own schedule, so a change made on the machine appears here once the agent has next reported it, not the instant it is made.
Asking the SOC without the preamble
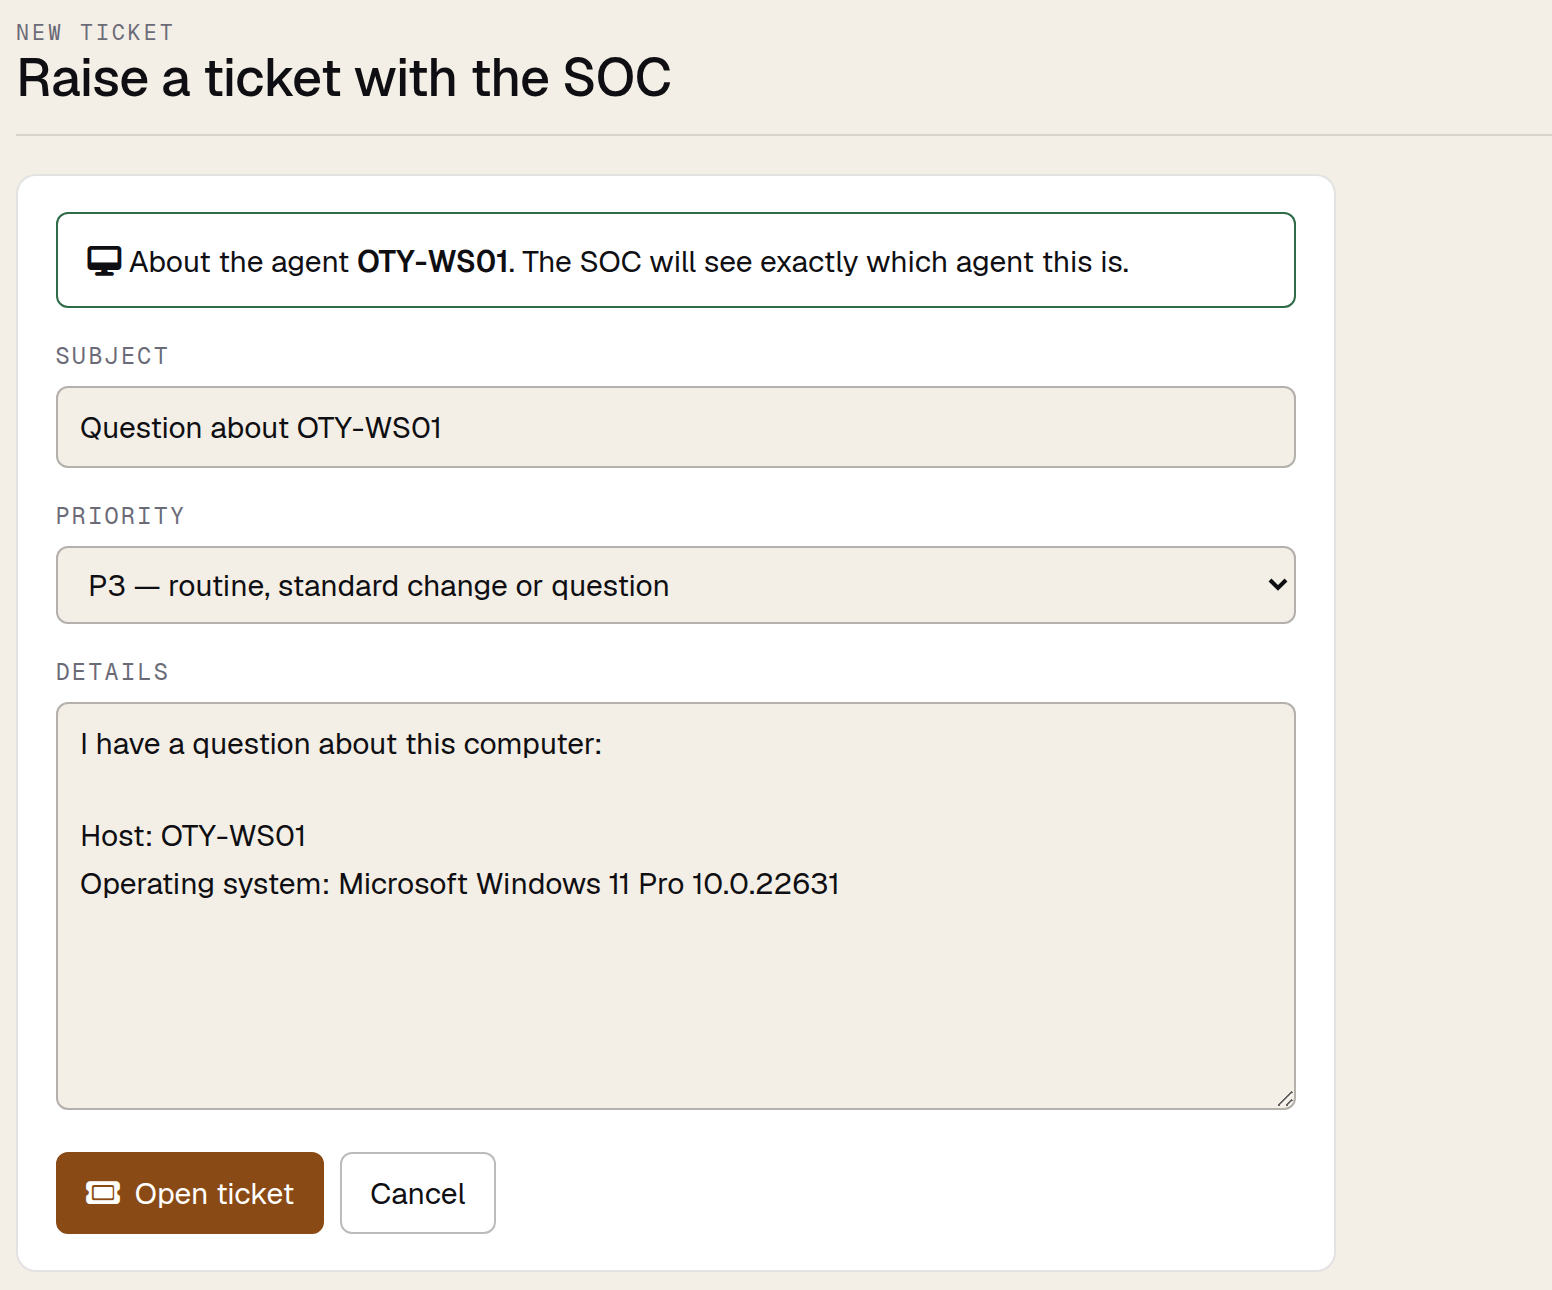
Anyone who has raised a support ticket about a specific machine knows the first exchange is usually not about the problem. It is about establishing which machine, which event, at what time, in which time zone. The release removes that exchange. Ask the SOC about this event, on any opened event, and Ask the SOC about this agent, at the top of every agent page, open the new ticket form with a subject and a short description already filled in and the event or agent attached. You add your question, adjust the priority if you need to, and select Open ticket. The analyst who picks it up receives the exact event or agent, the ticket page shows which machine it concerns with a link back to it, and the conversation starts where it should, at the question itself. Ask the SOC at the top of the SIEM page opens a blank ticket for anything else.
There is a behavioural reason for making this so easy, beyond saving a few minutes. People ask fewer questions than they would like to, because asking has a cost: finding the details, writing them up, worrying about looking as though they are fussing. Lower that cost enough and the questions get asked, and a client who asks about an odd-looking event at two in the afternoon is doing exactly what we want. The alternative is a client who notices something, decides it is probably nothing, and mentions it three weeks later in a review meeting. We would rather have the ticket.
Agents and reporting hosts: two lists, two questions
The Reporting hosts tab, previously Connected agents, lists every host that has sent an event to the SOC for your organisation within a chosen window, from the last ten minutes to the last seven days, most recent first. Because it is drawn from the events themselves rather than from the agent register, it can include devices that report to us without a Wazuh agent as well as your agents. Hosts that are enrolled agents link to their agent page, and Download CSV saves the list as a spreadsheet file. A host marked Legacy has not yet been given a classification in our platform, and the SOC can assign one on request.
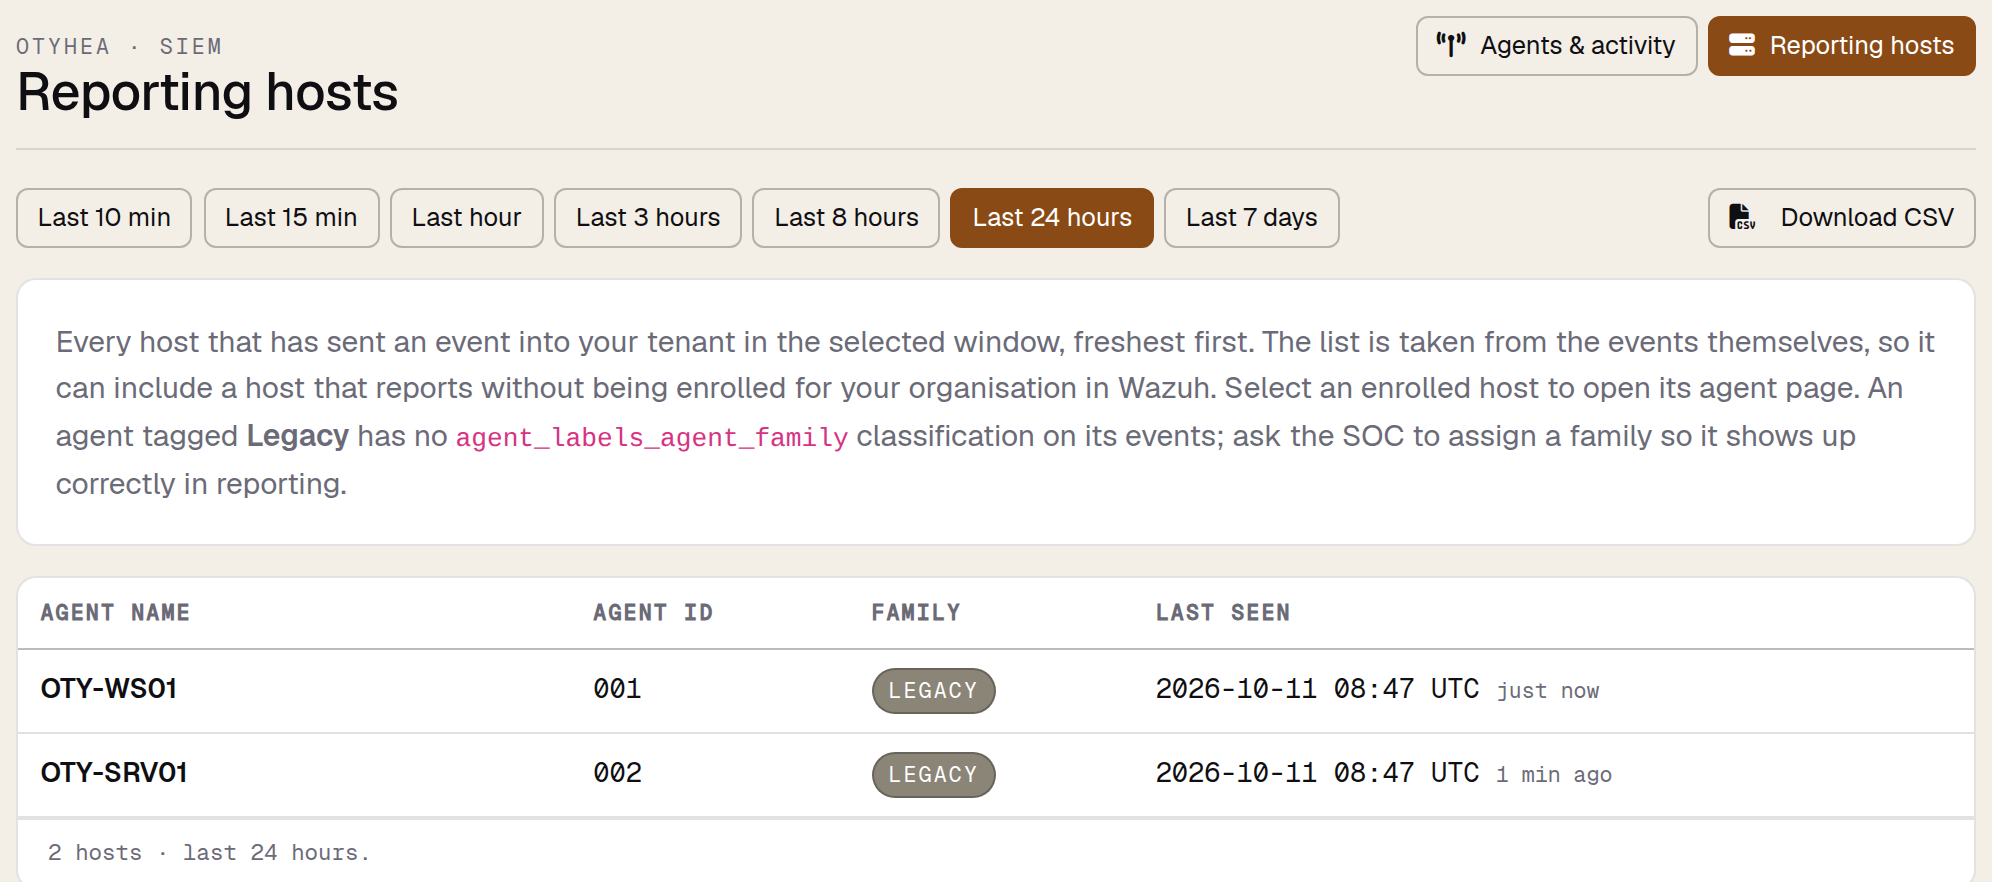
It is worth being clear about why there are two lists, because they look similar and answer different questions. The agents list on Agents & activity shows what is enrolled, whether or not it has reported recently. Reporting hosts shows what has actually reported within the window. A machine present in the first and absent from the second is one that is supposed to be talking to us and is not, and comparing the two is the quickest way to find it. An asset inventory and a telemetry inventory are not the same thing, and a good deal of the quiet work of running a SOC consists of noticing where they diverge.
What the SOC still does for you
A few things remain deliberately in the SOC's hands. Upgrading the agent software, moving an agent between policy groups and removing a machine that has been retired are all done by our analysts rather than from the portal. This is not a matter of withholding control; it is that monitoring only works if it is consistent across an estate, and a change made to one machine in isolation tends to create exactly the kind of gap the Reporting hosts tab exists to reveal. If you would like any of these done, ask the SOC about the agent concerned and it will be scheduled, and the Agent version line on the agent page will show the upgrade's progress and result as it happens.
Everything in the SIEM section is limited to your own organisation. You see only the agents enrolled for you and only the events recorded for you, and a machine you expect to see but do not is a reason to ask the SOC, who will check its enrolment. All times are shown in UTC, which is how the SOC works and how our reports are written, so there is no translation to do between what you see and what an analyst sees. The section works on a phone or tablet as well as in a desktop browser, which matters more than it might seem: the moment you most want to glance at a machine is rarely the moment you are sitting at a desk.
Why we built it this way
I want to close with the reasoning, because it is the part that will outlast any particular feature.
The first principle was that the client should see what the analyst sees. It would have been easier, and arguably more conventional, to build a tidy client dashboard with a few reassuring numbers and keep the working tools inside the SOC. We did not do that, and the reason is that the value of a shared picture is enormous and the value of a simplified one is small. When you ring us about a server and we are both looking at the same page, with the same event reference at the foot of the same event, the conversation is about the problem. When you are looking at a summary and we are looking at the detail, the conversation is first about reconciling the two. A great many of the frustrations people report with managed services come down to that reconciliation, and the way to remove it is not a better summary but the same screen.
The second principle was that the service should be visible when it is working, not only when it is not. It is a strange feature of security spending that the better it performs the less there is to show for it, and we think that is a design failure rather than a law of nature. The live activity view exists so that a client can open Pulse on an ordinary Tuesday, see the events arriving and being classified, see that the estate is quiet and the agents are reporting, and close it again. Nothing has happened, and that is the product. We have written before about why an AI-assisted SOC lets company owners sleep better; the SIEM section is what that looks like in daylight. We sell good mornings, not nightmares, and a good morning is easier to believe in when you can see it.
The third principle was to remove friction from asking. The agent page answers most questions on its own, and the ones it cannot answer are one button from a ticket that already contains the context. We would rather field a hundred small questions than miss the one that mattered because raising it felt like too much trouble.
If you are a UK Cyber Defence client, the section is live for everyone in your organisation who uses Pulse, and if you would like a walkthrough for your team, raise a ticket or speak to your account manager. We would also like to hear what else you would find useful on the agent page, because the version released this week is the one we were confident in, not the one we have finished imagining. If you are not a client and are weighing up a managed SOC, our questions to ask a SOC provider include several about transparency, and the simplest test of any provider's answer is to ask to see the screen their analysts use. If the answer is yes, you are probably in good hands. If the answer is that clients get a different view, it is worth asking why.
Frequently asked questions
Do I need to install or change anything to use the new SIEM section? No. The section is part of Pulse and is available to everyone in your organisation who already uses the portal. The agents it shows are the Wazuh agents already enrolled as part of your monitoring, and the events are those our SOC already records.
Is the data shown in Pulse live? The SOC activity views check for new events every thirty seconds on the main page and every fifteen seconds on an agent's page, and the connection status is never more than about a minute old. Details that come from the agent itself, such as the hardware and software inventory, the configuration assessment and the file integrity status, are read from our SIEM at least every ten minutes and can be refreshed on demand. The agent gathers those on its own schedule, so a change on the machine appears once the agent next reports it.
What do the priorities P1 to P5 mean? P1 is the most urgent and P5 the least. Setting a minimum priority of P3 and above hides routine informational events and leaves the ones most worth reading. The priority is assigned by the detection rule that recognised the event.
What is the difference between the agents list and Reporting hosts? The agents list shows every Wazuh agent enrolled for your organisation, whether or not it has reported recently. Reporting hosts shows every host that has actually sent an event within the chosen window, which can include devices such as firewalls that report without an agent. A machine in the first list but not the second has gone quiet and is worth asking about.
What are the KEV and exploit tags on a vulnerability? KEV means the vulnerability appears in the Known Exploited Vulnerabilities catalogue maintained by the US Cybersecurity and Infrastructure Security Agency, which lists flaws that have been used in real attacks. The exploit tag means a public exploit is known to exist. Either is a stronger reason to prioritise a fix than the CVSS score alone.
Can I upgrade or remove an agent from Pulse? Not directly. Agent upgrades, changes to the policy group an agent belongs to, and removal of retired machines are carried out by the SOC so that monitoring stays consistent across your estate. Use Ask the SOC about this agent and the work will be scheduled; the Agent version line on the agent page shows an upgrade's progress and result.
Can other clients see my machines or events? No. Everything in the SIEM section is limited to your own organisation. You see only the agents enrolled for you and only the events recorded for you.
What happened to the Connected agents and SOC activity pages? They have moved into the SIEM section. Connected agents is now the Reporting hosts tab, and SOC activity is the activity view at the top of the Agents & activity page. Existing links and bookmarks continue to work and open the new location with the same time span and filters.
Written by
Founder and Head of Threat Disruption
Founder of UK Cyber Defence. Former Global CISO for a FTSE 100 gaming company and for Microsoft Europe; founded Hedgehog Security in 2009.
Next step
Want this looked at in your own estate?
Thirty minutes with an analyst, not a salesperson. We will tell you whether it matters to you and what to do first.
Related insights
How Alert Fatigue Destroys Security Teams — and How Managed SOC Solves It
The modern SOC is drowning. Industry research consistently reports that organisations receive thousands of security alerts per day, that the majority are false positives, and that analysts are leaving the profession faster than the industry can replace them. Alert fatigue is not a minor inconvenience — it is a structural vulnerability that attackers actively exploit. When every alert looks the same, none of them look important. This article examines the mechanics of alert fatigue, its quantifiable cost to organisations, and the specific practices a well-engineered managed SOC deploys to break the cycle — because the solution is not working harder, but building a fundamentally different operational model.
Iranian state spyware ‘CHOSEN BRICK’: what it does and what to do
The NCSC, FBI and AIVD have exposed Iranian spyware — CHOSEN BRICK — used to surveil dissidents, activists and journalists. What the campaign does, who is really at risk, and the practical steps that protect the people targeted and the organisations around them.
How SOC as a Service Supports FCA, DORA and NIS2 Compliance
The regulatory environment for cyber security has undergone a fundamental shift. The FCA's PS21/3 operational resilience framework is now fully enforceable, DORA has been in effect since January 2025, and NIS2 transposition is reshaping obligations across the EU — with the UK's own Cyber Security and Resilience Bill following close behind. For organisations navigating these overlapping requirements, a well-structured SOC as a Service engagement is no longer a convenience. It is a compliance enabler. This article maps the specific requirements of each framework to the capabilities a modern managed SOC should deliver.